
Last month, 16,000 people opened Fieldnote Linen's best product page. 960 of them put the $64 linen shirt in their cart. 320 bought it.
The other 15,680 left. Nobody wrote in to say why. The store's two owners pack orders, answer email and run ads, and nobody on that team of two has a free afternoon to find out.
16,000 visitors × 0.5% more buying × $64 shirt. From traffic the store already pays for.
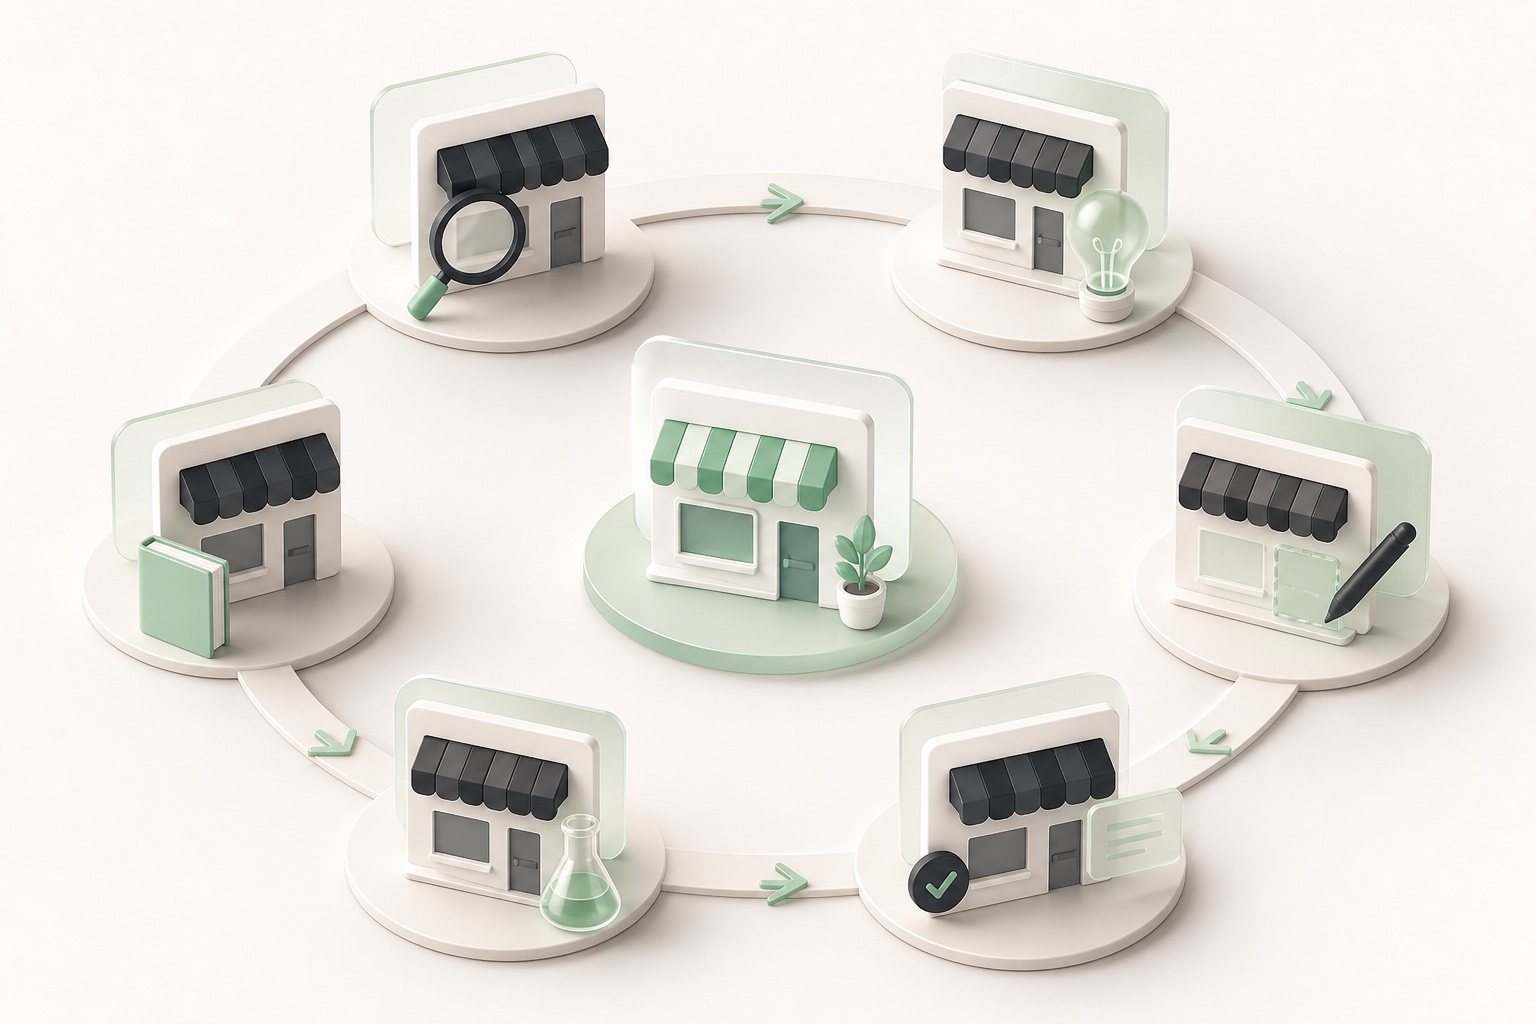
Here is how the A/B Agent goes looking for that money. Seven agents each do one job and hand the result to the next. The owners make one decision.
Day 1. The analyst finds the leak
The analyst reads the stats of every page and every product, split by phone and desktop. It skips the store-wide average, because averages hide where buyers leave.
The linen shirt gets the most visits and loses the most buyers. 72% of its visits are on phones.
Phone visitors who open the size guide buy three times as often as those who don't. Only 1 in 9 find it: it sits below the reviews, four screens down.
Day 2. The psychologist names the reason
A number shows where shoppers leave. It doesn't say why. The psychologist matches the pattern against Prettifai's library of 106 shopper-psychology principles.
This is fit doubt. A shopper who can't tell which size to pick sees a wrong size as a lost $64 plus a trip to the post office, and leaves instead.
Matching principle: loss aversion. Shoppers weigh a possible loss more heavily than the same-sized gain.
Day 3. The scout checks the competition
Fieldnote's shoppers have three other linen stores open in tabs. The scout reads their product pages the way a shopper would.
2 of 3 competitors show the model's height and size right above the size buttons. 1 adds "Relaxed fit. Between sizes? Size down."
Fieldnote shows neither. Its fit advice exists, but only inside the size guide nobody finds.
Day 4. The strategist writes the roadmap
Ideas are cheap. The strategist turns them into hypotheses and ranks them by money at stake, strength of evidence, effort to build, and whether the page has enough traffic to get a clear answer.
Roadmap, ranked:
- Fit line above the size buttons. Most evidence, smallest change, readable in about five weeks.
- Review stars next to the price. Good evidence, queued second.
- Two-shirt bundle. Needs a pricing decision from the owners first.
Day 5. The builder makes the variant
The builder creates the new version for phone and desktop. Only one thing changes, so the test can show what caused the result.
Linen camp shirt
$64
Size guide: below reviews
Linen camp shirt
$64
Model is 6'1" and wears M. Relaxed fit: between sizes, size down.
Day 6. QA tries to break it
Checked on 6 phone sizes and 3 desktop widths. The fit line wraps cleanly down to 320px. Load time unchanged.
The live theme was not touched. The variant waits for approval.
Day 7. The owners decide
This is the only step that needs a human. The owners see the current page, the variant, the reason, and what will be measured.
Test the fit line on the linen shirt. Half of visitors see it for about five weeks. Add-to-cart rate decides. Orders, return requests and load time must not get worse.
Weeks 2 to 6. The statistician waits
The statistician fixed the sample before launch: about 9,000 visitors per version to spot a one-point change in add-to-cart rate. It doesn't peek and call the test early, because early calls are how stores ship changes that never worked.
- Add to cart
- 6.0%
- Bought
- 186 shirts
- Return requests
- 9
- Add to cart
- 7.2%
- Bought
- 223 shirts
- Return requests
- 7
Day 43. One more tap, and the next test starts
The agents recommend making the fit line permanent. The owners approve it. The result goes into the store's playbook, so the agents know fit doubt matters for these shoppers and look for it on the other shirts.
Test number two, review stars next to the price, is already built and waiting for approval.
What that team would cost to hire
Seven jobs did that work. Using the closest U.S. occupations, the Bureau of Labor Statistics puts their combined median pay at about $747,000 a year, before benefits. Small stores don't hire that team, so the work doesn't get done. The A/B Agent is planned at $399 a quarter.
Price and availability
The A/B Agent is planned for November 2026 at $399 per quarter, and the launch offer includes the $99 Full Website redesign. It is optional: neither redesign plan requires it. Request early access on the pricing page.
Sources
- Evan Miller: How Not To Run an A/B Test
- Evan Miller: Sample size calculator
- U.S. Bureau of Labor Statistics: Data scientists, median pay May 2025
- U.S. Bureau of Labor Statistics: Market research analysts, median pay May 2025
- U.S. Bureau of Labor Statistics: Marketing managers, median pay May 2025
- U.S. Bureau of Labor Statistics: Web developers, median pay May 2025
- U.S. Bureau of Labor Statistics: Software QA analysts and testers, median pay May 2025
- U.S. Bureau of Labor Statistics: Statisticians, median pay May 2025